Music Visualiser Deep Dive: How It Works and Why It Pops
MuseGen Team
5/4/2026
A music visualiser is that friend who can't sit still during a song - it has to move, flash, and react. You press play, and suddenly your audio becomes shapes, colors, and motion that feel "locked in" to the beat. If you've ever wondered what a music visualiser is actually reading from the sound (and why some look tight while others feel random), this deep dive breaks it down in plain, practical terms.
At its core, a music visualiser turns sound into data, then maps that data to visuals in real time (or during rendering). The "pop" comes from choosing the right audio features, smoothing them the right way, and designing motion and color that match human perception - not just raw numbers.
What a Music Visualiser Actually Does (In One Sentence)
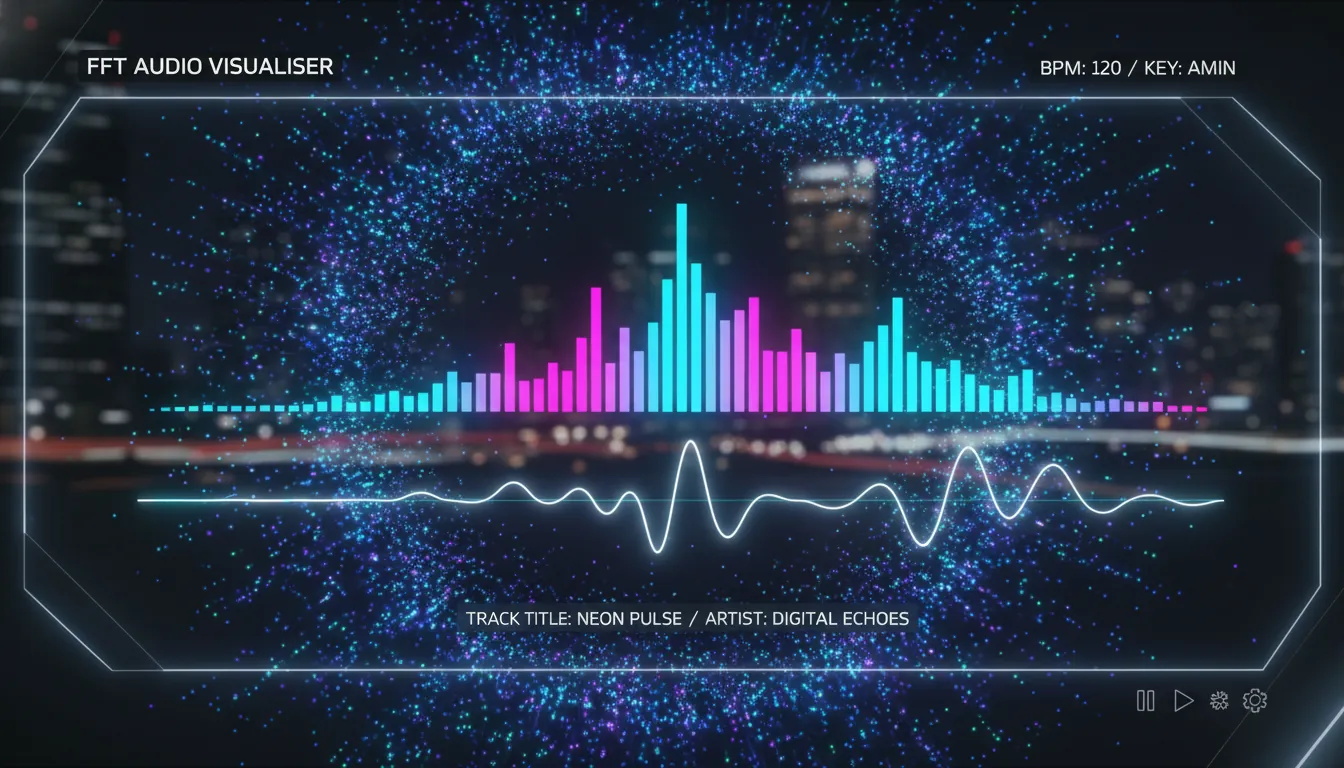
A music visualiser continuously measures changes in an audio signal (loudness, frequency energy, transients, rhythm), then drives visual parameters like scale, color, glow, particles, camera shake, and scene transitions.
That definition aligns with the classic idea of music visualization: animated imagery synchronized to music, often in real time, using loudness and the frequency spectrum as key inputs (see Music visualization (Wikipedia)).
The Two Main Ways a Music Visualiser "Sees" Audio
Most systems combine both approaches below. When I build or tune visualisers, I start by deciding which visuals should be time-domain (punchy, rhythmic) and which should be frequency-domain (tonal, colorful, wide).
1) Time-domain (Waveform / Amplitude Over Time)
Time-domain analysis looks at the waveform directly.
Common features:
- RMS loudness (overall perceived strength)
- Peak amplitude (fast spikes for "hit" moments)
- Envelope follower (smooth loudness curve for stable motion)
Why it matters: time-domain features are great for "bounce," "pulse," and "camera kick" - anything that should react instantly.
2) Frequency-domain (FFT Spectrum)
Frequency-domain analysis uses an FFT (Fast Fourier Transform) to split audio into frequency bands (bass/mids/highs). This is the backbone of spectrum bars, radial spectrums, and frequency-based color changes.
You'll see this explained in many audio visualizer guides: FFT gives you band energies you can map to different graphic elements (a helpful overview is in From Sound Waves to Visual Art: How Music Visualizers Work).
The Typical Music Visualiser Pipeline (Step-by-Step)
A reliable music visualiser usually follows this chain. The difference between "meh" and "wow" is mostly in steps 3-5.
- Audio input
- File playback, microphone, or system audio loopback
- Pre-processing
- Mono mixdown, normalization, optional EQ (often low-pass for beat emphasis)
- Analysis
- Waveform metrics + FFT spectrum bands
- Feature extraction
- Beat/onset detection, band energy (kick/snare/hat ranges), loudness envelope
- Smoothing + gating
- Attack/release smoothing, noise floor, dynamic thresholds
- Mapping to visuals
- Scale -> loudness, color hue -> centroid, particles -> transients, etc.
- Rendering
- GPU shaders / canvas / game engine / compositor
FFT, Bands, and Why "Bass Drops" Look So Good
FFT gives you magnitudes across frequency bins. Most visualisers group bins into a smaller number of bands (e.g., 16/32/64 bands) because:
- It's more stable visually than hundreds of bins.
- It maps cleanly to UI elements (bars, rings, LED columns).
A practical trick: use log-spaced bands (more detail in lows) since humans perceive pitch logarithmically. This is why bass feels "bigger" when the visualiser allocates more resolution to low frequencies.
If you're building beat-centric visuals, you often bias toward low frequencies first. An engineering-minded summary of "you may not need perfect beat detection if the display is correlated with bass-band energy" appears in this Arduino FFT beat detection discussion: FFT Beat Detection esp32 (Arduino Forum).
Beat Detection: The Difference Between "Reactive" and "On-Beat"
Many music visualiser designs look synchronized without explicitly detecting beats. They just map bass energy or overall loudness to motion, and your brain does the rest.
When you do need explicit beats (for scene cuts, typography hits, or one-frame flashes), common approaches include:
- Energy-based beat detection (instantaneous energy vs. adaptive threshold)
- Band-limited detection (kick in lows, hat in highs)
- Energy history + FFT sub-bands (more robust, uses short-term context)
A clean summary of FFT sub-bands + energy history beat detection is documented here: Beat Detection (Georgy Dev Docs). For adaptive thresholding concepts (variance-based threshold), academic lecture notes like Lecture 14: Beat detection (Imperial College) explain why static thresholds fail across different songs.
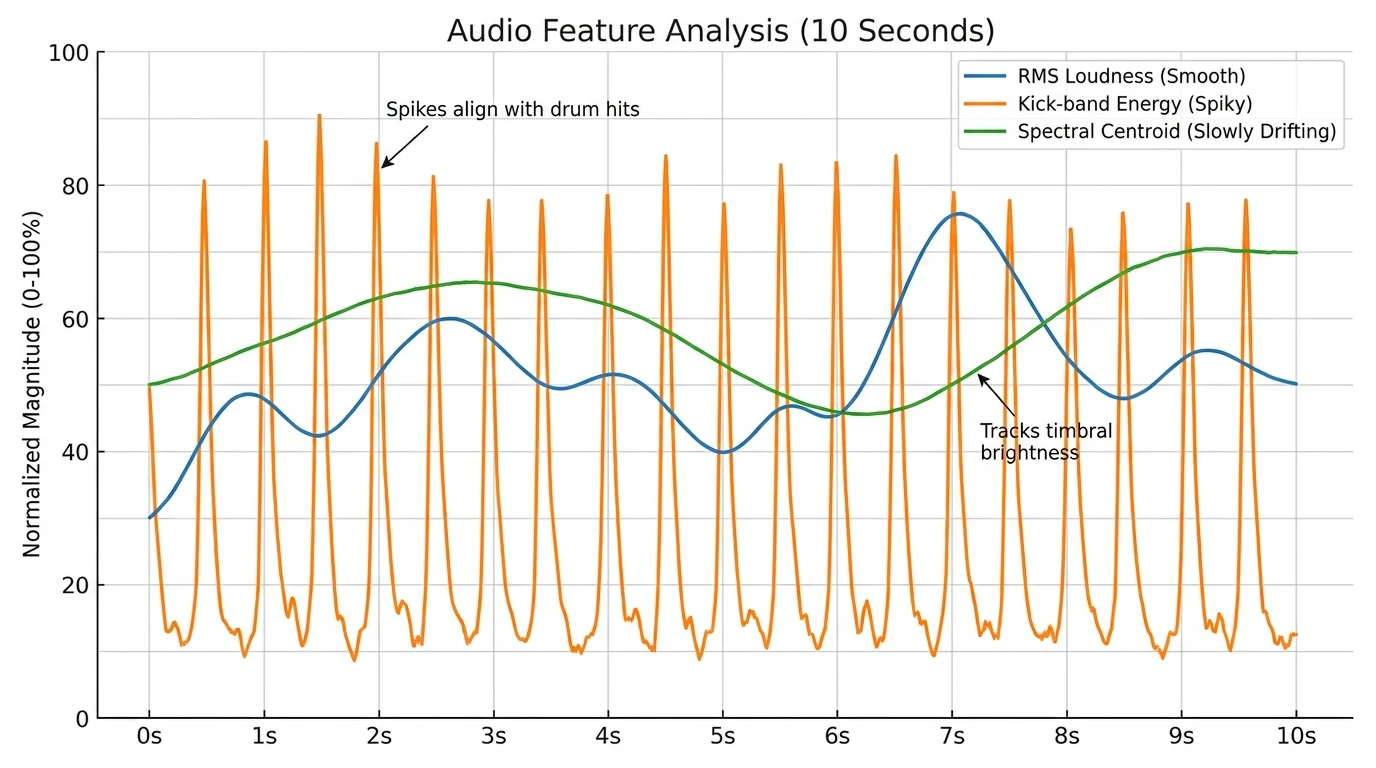
The Secret Sauce: Smoothing (So Your Visuals Don't Jitter)
Raw audio features are noisy. A music visualiser "pops" when it has controlled motion - fast when it should be fast, calm when it should be calm.
What I've found works best in real projects:
- Attack/Release smoothing: fast response on increases, slower decay on decreases.
- Noise floor + gate: ignore tiny values so idle parts don't shimmer.
- Auto gain / adaptive scaling: prevent quiet tracks from looking dead and loud tracks from clipping.
An envelope follower (a smoothed amplitude tracker) is a classic technique; even microcontroller-focused discussions describe it as a foundation for "beat-like" visual correlation (see the envelope/average discussion in the Arduino Forum thread).
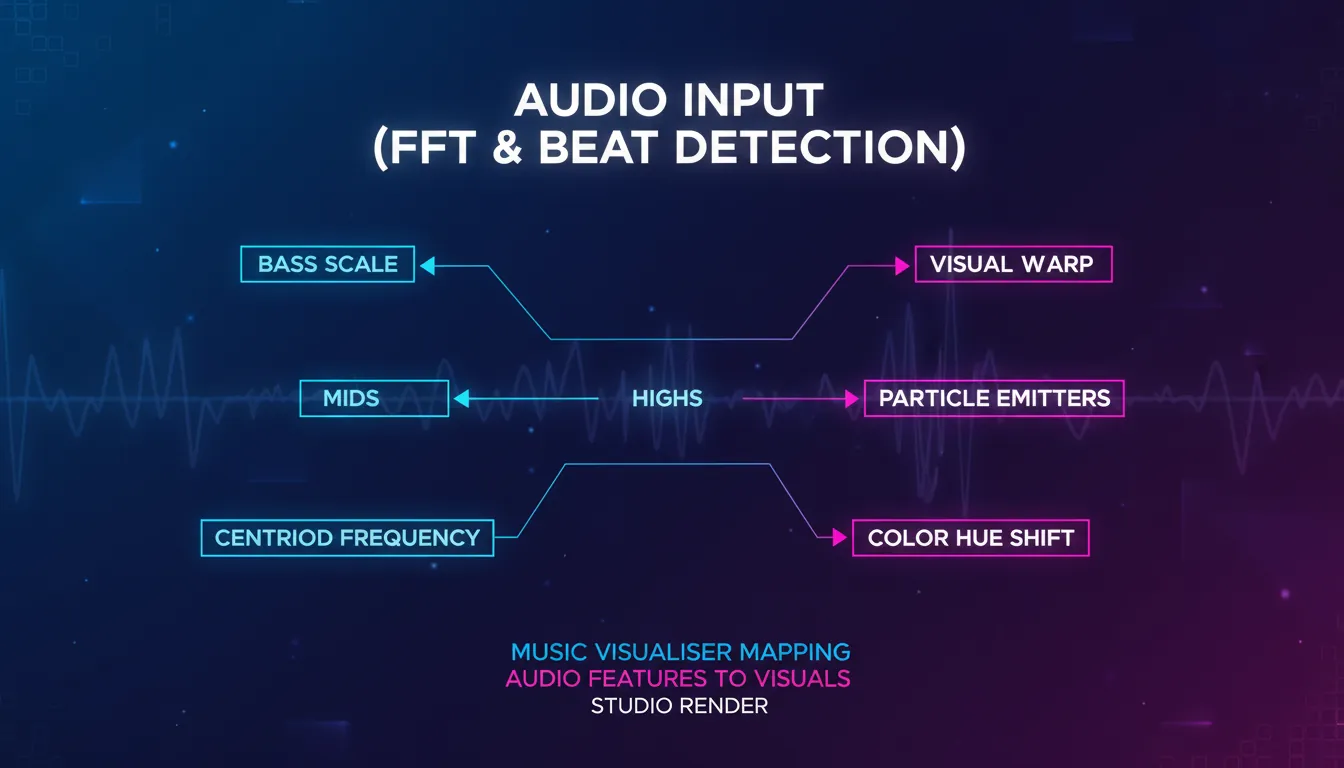
Mapping Audio to Visuals: What Viewers Actually Feel
The mapping stage is where "engineering" becomes "design." You're not just drawing bars - you're building a readable visual language.
High-performing mappings (that look intentional)
- Bass (20-120 Hz) -> scale/pulse (big movement)
- Mids (250 Hz-2 kHz) -> deformation/waves (musical body)
- Highs (6-12 kHz) -> sparkle/particles (detail and air)
- Spectral centroid -> hue shift (brighter sound -> "hotter" colors)
- Transients/onsets -> flashes/cuts (attention control)
Color theory that keeps it clean (not chaotic)
Motion designers often use Hue/Saturation/Value thinking and composition rules like 60-30-10 to avoid visual clutter. If you want a practical color foundation, this motion design overview is a good baseline: A Guide to Color Theory for Motion Design.
Common Music Visualiser Styles (And What They're Best At)
| Style | What it visualizes best | Typical audio features | Best use cases | Risk if done poorly | | ------------------------ | ----------------------- | ---------------------------- | -------------------------- | ---------------------------------- | | Waveform (oscilloscope) | Timing, speech clarity | amplitude/peaks | podcasts, voiceover videos | looks flat for complex music | | Spectrum bars | Frequency balance | FFT band magnitudes | YouTube audio videos, DJs | jittery bars without smoothing | | Radial spectrum | Energy + aesthetics | FFT bands + rotation mapping | EDM/ambient branding | can feel "samey" across songs | | Particle field | Transients + shimmer | highs + onset triggers | cinematic, lo-fi, trailers | visual noise / clutter | | Generative shader scenes | Mood + immersion | multi-feature mapping | live shows, art visuals | heavy GPU cost, hard to art-direct |
If you're choosing tools for real-time performance vs. offline rendering, note the trade-off: real-time systems prioritize responsiveness, while offline workflows can spend more compute on polish. Tool roundups often separate those use cases (see the real-time vs. rendering distinction discussed in Create Stunning Visualisation Music Experiences).
Why Music Visualisers Became a "Default" Music Video Format Again
Music visualisation has been around for decades - from early computer experiments to Winamp's plugin era, where visualisation plugins became a culture of their own. Winamp's plugin architecture (late 90s) helped popularize community-built visual styles, many of which still influence today's aesthetics (background reading: The History of Winamp's Visualizations).
Today, a music visualiser is also a practical distribution asset:
- You can ship a visual identity for every track without filming.
- Platforms reward video even for audio-first releases.
- Templates + automation make it scalable for creators and brands.
How MuseGen Fits: From AI Music to One-Click Visuals
If you're generating tracks quickly, the bottleneck often becomes: "Now what do I post with it?" In my experience, pairing rapid music creation with a consistent music visualiser style is the fastest way to publish professional-looking content without a full video shoot.
MuseGen's workflow (AI music generation + stem exports + One-Click MV Generator) is naturally aligned with visualiser-driven publishing:
- Generate a track (text-to-music, lyrics, or image prompts).
- Export WAV stems/MIDI for tighter feature mapping (kick stem -> kick visuals).
- Produce an automated music video quickly, then refine brand colors and motion.
If you're building a pipeline, consider keeping:
- One consistent visual theme (brand recognition)
- Two or three "moments" (intro, drop, outro) driven by beats/onsets
[Unity] Audio Visualization - FFT & Beat Detection
Quick Checklist: Make Your Music Visualiser Look "Pro" (Not Random)
- Pick 3-5 features max (loudness, bass energy, centroid, onset, tempo).
- Smooth everything with attack/release.
- Use band-limited triggers (kick != hi-hat).
- Design with constraints
- 60-30-10 color balance
- consistent camera rules
- Test across genres
- EDM, hip-hop, acoustic, spoken word
FAQ: Music Visualiser Questions People Search
1) What is a music visualiser used for?
A music visualiser turns audio into animated graphics for YouTube uploads, live shows, DJ sets, podcasts, and brand content where motion increases attention.
2) Do music visualisers need FFT?
Not always. Simple visualisers can use loudness or waveform peaks, but FFT enables frequency-aware visuals (bass vs. highs), which usually look richer.
3) How does beat detection work in a music visualiser?
Common methods compare short-term energy to an adaptive threshold, often using low-frequency bands for kick detection and energy history for stability.
4) Why does my visualiser flicker or feel off-beat?
Usually it's insufficient smoothing, no noise gate, or mapping visuals to the wrong band (e.g., using full-spectrum loudness instead of kick-band energy).
5) What's the difference between a visualiser and a full music video?
A music visualiser is typically procedural and audio-reactive, while a music video is edited footage with narrative or performance. Many creators use visualisers as lightweight "official video" formats.
6) Are real-time visualisers better than rendered ones?
Real-time is best for performances and instant feedback. Rendered visualisers can look more polished because they can afford heavier effects and higher-quality motion blur.
7) Can I make a music visualiser from stems?
Yes - and it often looks better. If you have a separate kick, snare, bass, and vocal stem, you can map each to specific visuals for clearer, more intentional motion.
Conclusion: Why a Music Visualiser Still Wins Attention
A good music visualiser isn't magic - it's disciplined signal processing plus tasteful motion design. When the audio features are chosen well, smoothed properly, and mapped with visual hierarchy, the result feels "alive," not noisy. And when you're releasing tracks fast (especially in an AI-assisted workflow), a consistent visualiser style becomes your repeatable way to publish music that looks as professional as it sounds.